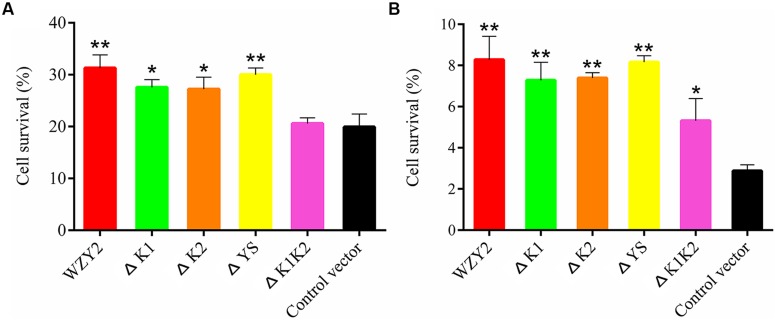
FIGURE 3.
The cell viability of Escherichia coli transformed with WZY2, ΔK1, ΔK2, ΔYS, and ΔK1K2 or the control vector when subjected to temperature stress. E. coli cells were exposed to 0°C (A) or 50°C (B) for 20 min, and CFUs were calculated. The cell survival ratio was derived from a comparison of CFUs at 37°C. Three independent assays were performed, and SE are included. Values are the mean ± SD (n = 3). Significant differences in the survival ratio are indicated as *P < 0.05 or **P < 0.01, which were evaluated with a t-test.

