Figure 2.

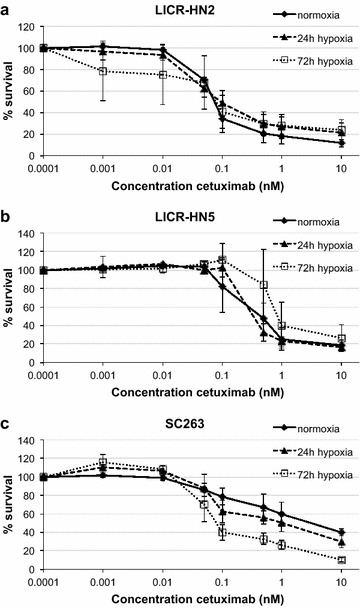
Cytotoxic effect of cetuximab. Dose–response curves of LICR-HN2 (a), LICR-HN5 (b) and SC263 (c) cells after 168 h of cetuximab treatment under normoxia and hypoxia (24 and 72 h).

Cytotoxic effect of cetuximab. Dose–response curves of LICR-HN2 (a), LICR-HN5 (b) and SC263 (c) cells after 168 h of cetuximab treatment under normoxia and hypoxia (24 and 72 h).