
Figure 1.
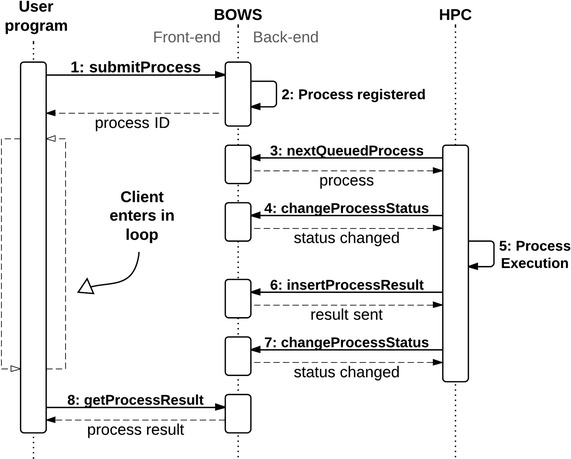
Sequence diagram showing the cycle of execution in BOWS. Front-end transactions are on the left while back-end transactions are shown on the right.
Official websites use .gov
A
.gov website belongs to an official
government organization in the United States.
Secure .gov websites use HTTPS
A lock (
) or https:// means you've safely
connected to the .gov website. Share sensitive
information only on official, secure websites.
Sequence diagram showing the cycle of execution in BOWS. Front-end transactions are on the left while back-end transactions are shown on the right.