
Figure 1.
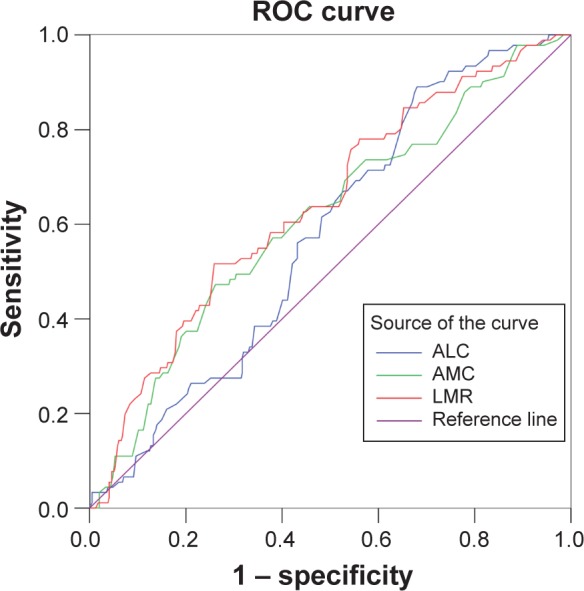
Receiver operating characteristic curves for the ALC, AMC, and LMR for RFS.
Notes: ROC curves were used to maximize the prognostic value of the LMR for RFS and OS. The ROC curve is actually composed of the two-dimensional coordinates of the point group N (sensitivity, 1 − specificity) plotted curves. Each point represents both the sensitivity and specificity of a test marker. The Youden index (ie, sensitivity + specificity −1), which indicates the maximum potential effectiveness of a biomarker, was chosen as the best diagnostic cutoff value in our paper. Examining RFS, the areas under the curve were 0.576, 0.611, and 0.640 in RFS for ALC, AMC, and LMR, respectively. Diagonal segments are produced by ties.
Abbreviations: ALC, absolute lymphocyte count; AMC, absolute monocyte count; LMR, lymphocyte/monocyte ratio; RFS, recurrence-free survival; ROC, receiver operating characteristic OS, overall survival.