
Figure 3.
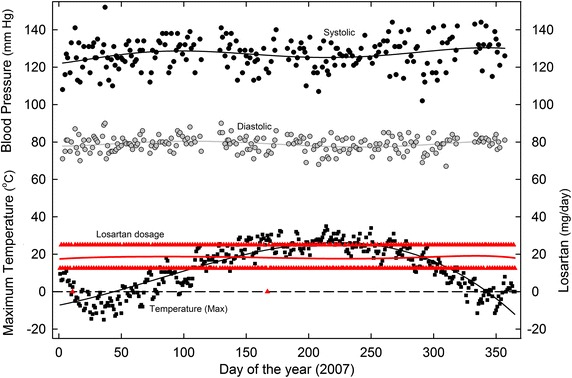
Daily variation in SBP and DBP in 2007, as related to (1) maximum daily environmental temperatures and (2) varying losartan dosage. Home BP measurements were usually twice daily—in the early morning and late evening—and these values were averaged for plotting. Least-squares regression (sixth order) polynomial fits to the points are shown as continuous lines (the fit is third order for the black temperature line). For other details see Figure 1.