
Figure 6.
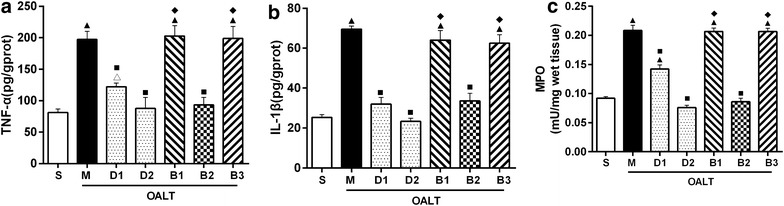
The concentrations of TNF-α (a) and IL-1β (b) and MPO activity (c) in lung tissues of different groups. The data are expressed as mean ± SD (n = 8). ▲ P < 0.01; △ P < 0.05 vs. group S; ■ P < 0.01 vs. group M; ◆ P < 0.01 vs. group D2.
Official websites use .gov
A
.gov website belongs to an official
government organization in the United States.
Secure .gov websites use HTTPS
A lock (
) or https:// means you've safely
connected to the .gov website. Share sensitive
information only on official, secure websites.
The concentrations of TNF-α (a) and IL-1β (b) and MPO activity (c) in lung tissues of different groups. The data are expressed as mean ± SD (n = 8). ▲ P < 0.01; △ P < 0.05 vs. group S; ■ P < 0.01 vs. group M; ◆ P < 0.01 vs. group D2.