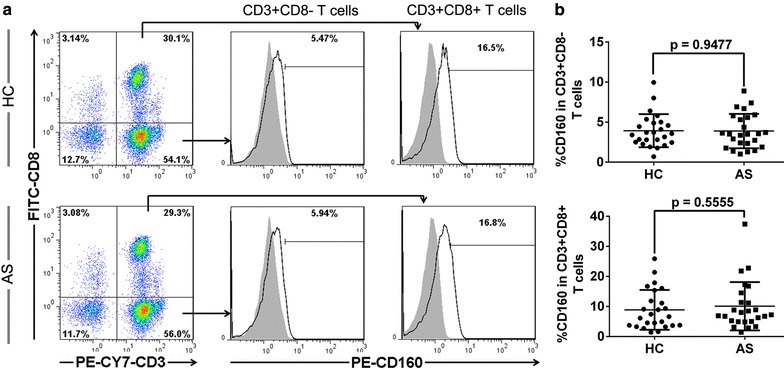
Figure 1.

Expression levels of CD160 on CD4+ T and CD8+ T cells in AS patients. Blood samples were collected to detect CD160 expression levels on both CD3+CD8+ and CD3+CD8− (most CD4+) T cells by flow cytometry. a Representative dot plots and histograms of CD160 expression on CD3+CD8− (most CD4+) and CD3+CD8+ T cells from HC (upper panels) and AS patients (bottom panels). b The percentages of circulating CD160+CD3+CD8− T cells (upper graph) and CD160+CD3+CD8+ T cells (bottom graph) in HC and AS patients with each dot representing one subject. Data are expressed as mean ± SD. Student t test (b).
