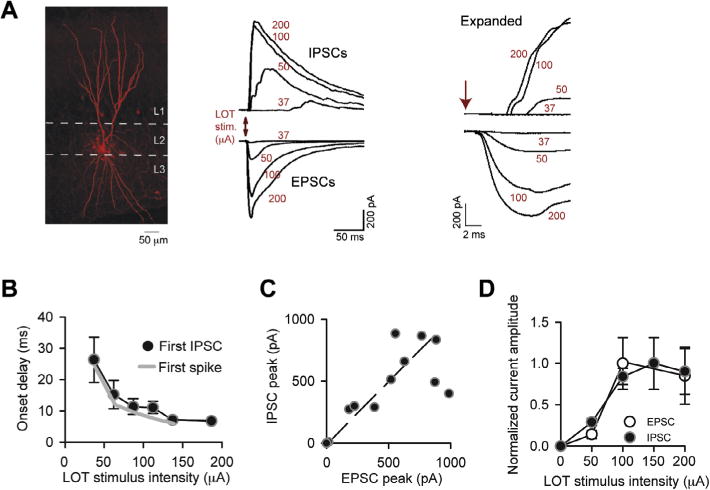
Fig. 2.

Inhibition is well-matched to excitation across LOT stimulus intensities. (A) IPSCs and EPSCs recorded in an SP cell in response to LOT stimulation at different intensities (indicated in red). IPSCs and EPSCs were recorded, respectively, at Vhold = −7 and −77 mV. In the expanded traces at right, monosynaptic EPSCs with short onset delays can be observed, while the onset delays of the IPSCs were longer. Traces reflect single trials. The EPSCs evoked by higher intensity stimuli likely included both monosynaptic and recurrent excitation. (B) The onset delays for the first spike were well-matched to the first IPSC in SP cells across LOT stimulus intensities. Spike onset delays (gray curve) reflect same data as in Fig. 1C. Data came from parallel recordings made in cell-attached (spikes) or whole-cell (IPSCs) modes. N values for each point for the IPSC data ranged from 3 to 20. (C) Inhibition scales in amplitude with excitation in SP cells. Each data point reflects peak EPSC and IPSC amplitude measurements made in a single cell at one stimulus intensity, averaged across ≥ 5 trials; data were pooled from seven recordings. Diagonal line reflects unity. (D) Average EPSC and IPSC amplitudes as a function of stimulus intensity, normalized to the peak current evoked by any stimulus in each recording. Stimulus intensities were grouped into 50-μA bins centered at the indicated values on the x-axis. N values for each data point ranged from 3 to 43. (For interpretation of the references to color in this figure legend, the reader is referred to the web version of this article.)
