Fig. 4.

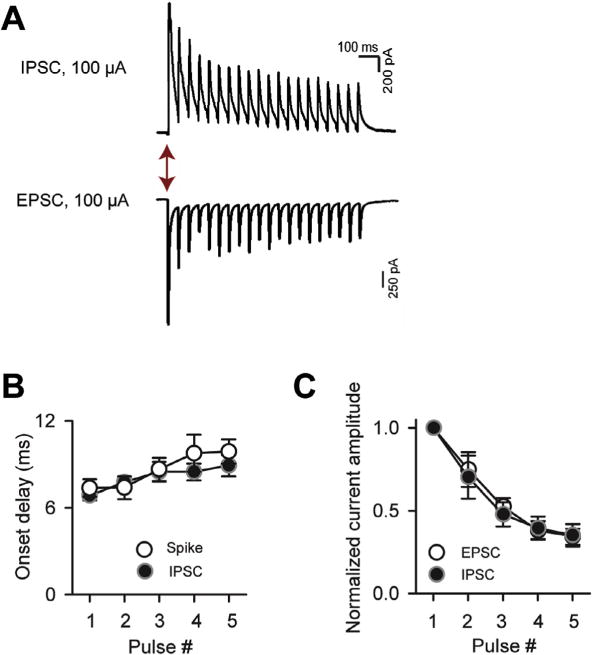
Inhibition is well-matched to excitation in SP cells across LOT stimulus trains. (A) IPSCs and EPSCs recorded in response to 20 Hz stimulus trains (20 pulses; 100-μA intensity). IPSCs and EPSCs were recorded, respectively, at Vhold = −7 and −77 mV. (B) The onset delays of the IPSCs (first-events) were well-matched to the spikes in SP cells across the first five pulses of the stimulus train. (C) EPSC and IPSC amplitudes as a function of stimulus number. Current values for each recording were normalized to the peak current evoked by any of the five stimuli. Note that both the EPSCs and IPSCs strongly depressed, but the currents remain well-matched in relative amplitude.
