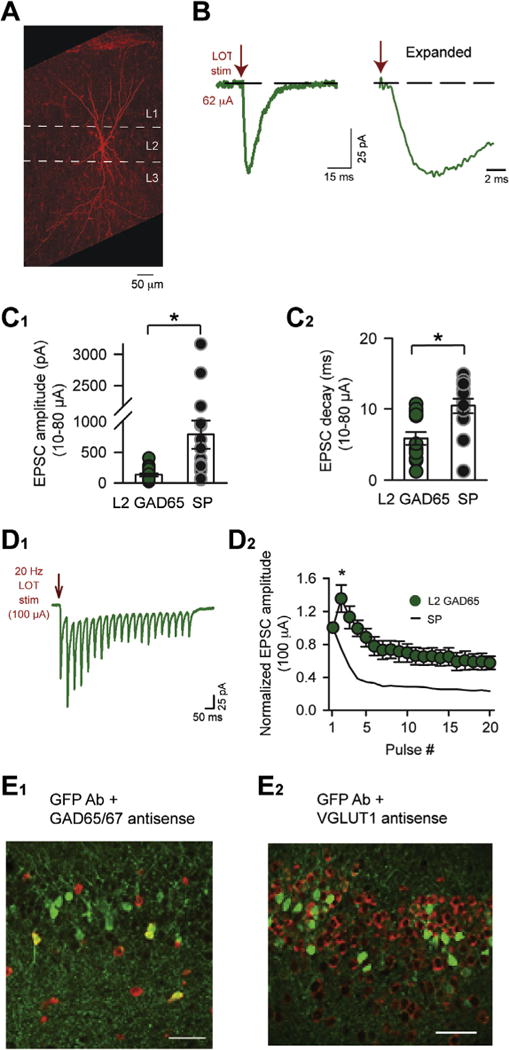
Fig. 5.

Characterization of L2 GAD65-eGFP cells. (A) An example biocytin-filled L2 GAD65-eGFP cell, showing a bitufted morphology with apical dendrites that extended high into L1 and basal dendrites. This cell also displayed an axon extending into L3. (B) Electrical stimulation of LOT induced monosynaptic EPSCs in an L2 GAD65-eGFP cell (average of 10 trials; Vhold = −77 mV). The fast onset-time of the EPSCs (1–2 ms) is clear in the expanded trace at right. (C) Summary of monosynaptic EPSC amplitude (C1) and decay (C2) in L2 GAD65-eGFP cells and SP cells following weak-to-moderate LOT stimuli (10–80 μA). Note the large differences in the EPSCs between cell-types, especially in amplitude. (D) L2 GAD65-eGFP cells and SP cells could be further differentiated based on their responses to 20-Hz LOT stimuli (100 μA). The evoked EPSCs in L2 GAD65-eGFP cells (raw traces in D1; summary in D2) displayed an initial facilitation, followed by depression, whereas EPSCs in SP cells were purely depressing at this stimulus intensity (black trace, same data as in Fig. 4C). Asterisk at pulse 2 indicates significant differences in the normalized EPSC values between L2 GAD65 eGFP and SP cells. (E) In situ hybridization and immunodetection of GFP. E1: Several GFP-positive cells (green) co-labeled with anti-sense probes for GAD (red; combination of probes for both GAD65 and 67). E2: In contrast, no GFP-positive cells co-labeled with an anti-sense probe for the vesicular glutamate transporter 1 (VGLUT1; in red).
