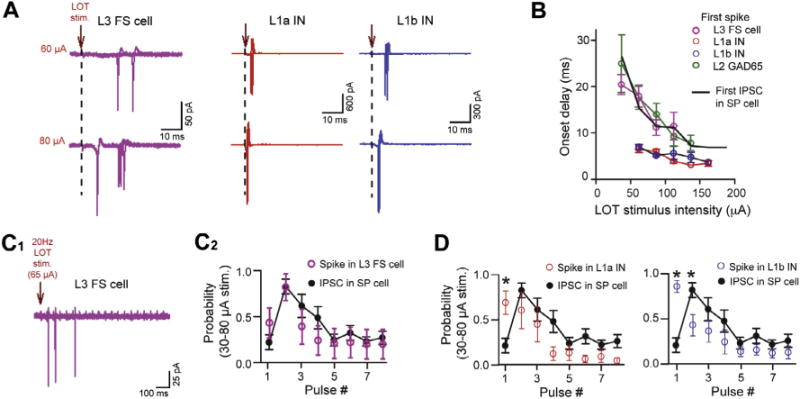
Fig. 7.

L3 fast-spiking (FS) cells mediate inhibition of L2 cells across variable LOT stimuli. (A) Example traces of spike activity recorded in cell-attached patches in an L3 FS cell (purple) and interneurons (INs) in L1a (red) and L1b (blue). Data are shown at moderate and higher stimulus intensities for each cell. (B) Summary. The onset delays to the first spikes in L3 FS cells, but not L1 INs, were well-matched to the first IPSCs in SP cells (black curve). The first spikes in L2 GAD65-eGFP cells were also matched to the IPSCs. The IPSC delays reflect the same data as in Fig. 2B; the spike data for L2 GAD65-eGFP cells reflect the plot in Fig. 6F. (C) Spiking in L3 FS cells during 20-Hz stimulus patterns was well-matched to the IPSCs in SP cells. Displayed are a sample trace of spike activity in an L3 FS cell (C1) and summary (C2) plotting the probability of L3 FS cell spiking or IPSC across the first eight stimuli. (D) Spike probabilities of INs in L1a (left) and L1b (right) were not well-matched to the IPSCs during 20-Hz stimulus trains.
