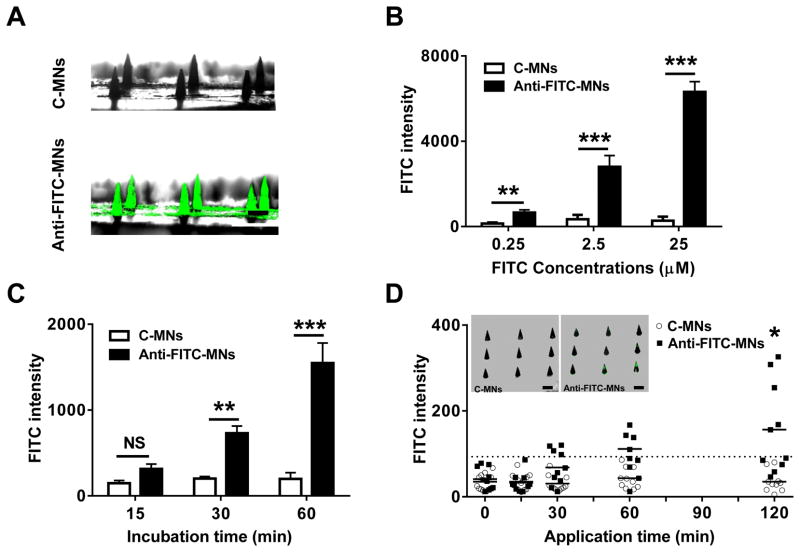
Fig. 1.
FITC measurement in vitro and in vivo by anti-FITC MNs. (A) Fluorescence images of anti-FITC-MNs and C-MNs. The MNs were incubated with 2.5 μM FITC in 2% BSA solution at 36 °C for 2 hr and photographed by fluorescent microscopy. FITC intensity consistently displays binding to anti-FITC-MNs but not C-MNs when concentration (B) or incubation time (C) is varied. n=6. (D) Detection of circulating FITC in vivo. FITC was i.v administered into mice, after which C-MNs (unfilled circle) and anti-FITC-MNs (filled square) were applied into the dorsal skin of the mice. The patches were removed at indicated times and fluorescence intensity in each array was determined. Each symbol represents one array containing 9 MNs, and a dashed horizontal line is a cutoff value for positive FITC binding on the array, which is defined as the mean value of c-MNs plus 3× standard deviation. Insets in (D) show fluorescence images of one C-MN array (left) and one anti-FITC array (right). Note that only 2 out of 9 MNs show significant FITC binding in anti-FITC MNs. Scale=100 μm.

