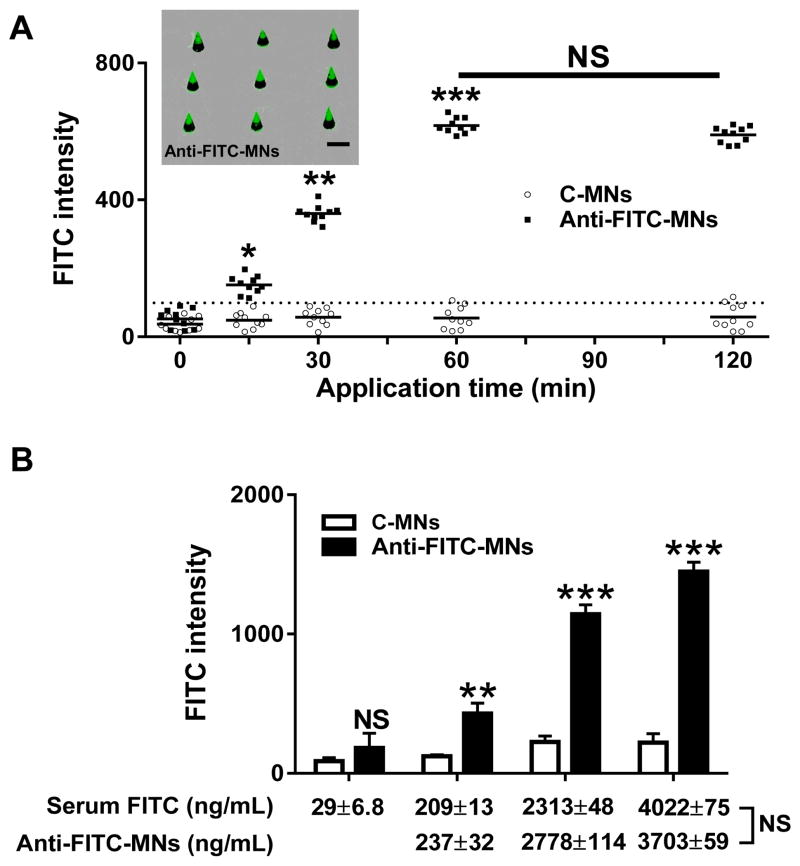
Fig. 3.
Quantification of circulating FITC by anti-FITC-MNs in laser-treated skin. (A) C-MNs (unfilled circle) and anti-FITC-MNs (filled square) were applied into laser-treated skin for indicated times in mice receiving FITC intravenously. Each symbol represents one array consisting of 9 MNs. The cutoff value is indicated by a dashed line and defined as Figure 1D. Inset shows fluorescence images of one anti-FITC-MN array. Note, all MNs in the array show uniform and strong FITC binding. Scale=100 μm. (B). The amounts of circulating FITC measured by anti-FITC-MNs are similar to those obtained with fluorescence spectrophotometer. Anti-FITC-MNs or C-MNs were inserted into laser-treated skin for 30 min in mice receiving varying amounts of FITC intravenously, and the FITC captured on MNs was calculated by FITC intensity in comparison with a standard curve run in parallel.

