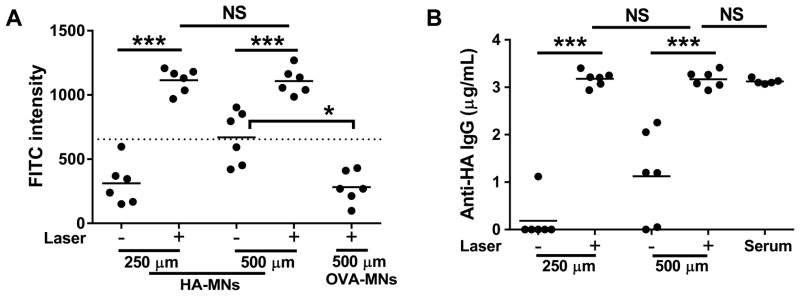
Fig. 6.

Measurement of anti-HA IgG in immunized pigs. (A) The amount of anti-HA IgG captured in the upper dermis was comparable to that in deep dermis after laser illumination. A dashed horizontal line is a cutoff value for positive FITC binding on the array as defined in Figure 1D. (B) The amount of anti-HA IgG in the upper dermis or dermis detected by MNs was similar to that in serum samples measured by conventional IF assays (serum).
