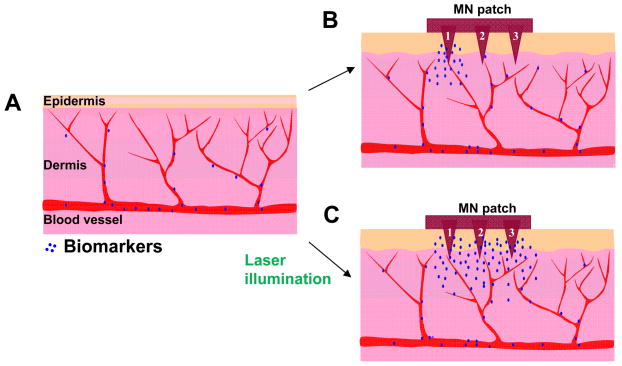
Fig. 7.
Schematic illustration of differences in distribution and concentration of circulating biomarkers in laser-treated and non-treated skins. (A) The skin without laser treatment. (B) Strong capture of circulating biomarkers occurs only on a MN that is physically close to a damaged capillary vessel like MN#1, but not on a MN that is away from an injured vessel like MN#3 in the absence of laser treatment. (C) In contrast, all MNs on the array are exposed to uniformly high concentrations of circulating biomarkers in laser-treated skin owing to laser-induced extravasation.

