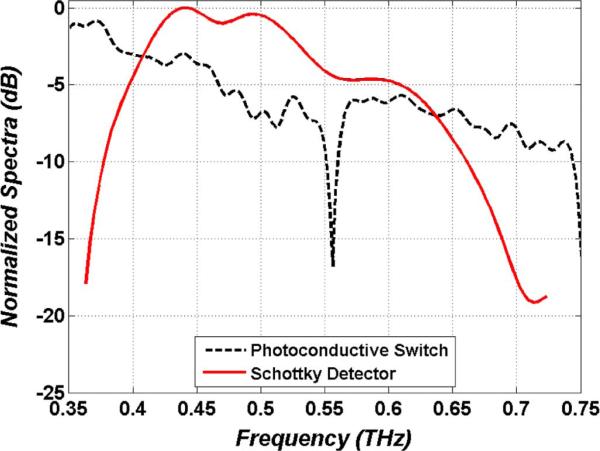
Fig. 9.
THz imaging system spectra. The dotted (black) line is the normalized photoconductive switch power spectral density. The solid line (red) is the Schottky diode normalized spectral responsivity. The response peaks at ~440 GHz and the total width reflects the operational band of a WR1.5 waveguide.

