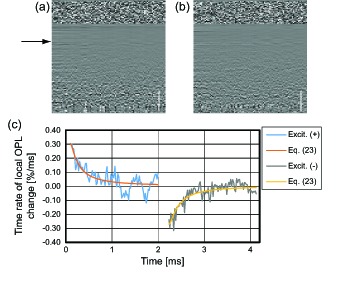
Fig. 4.

Photothermal signals in M-mode scan. Phase derivatives of two consecutive M-scans (a) when the excitation laser is on and (b) after the laser is turned off. (c) Temporal profile of photothermal signal. Scale bars are 500 μm in tissue. Each profile obtained at a certain depth of the porcine liver (black arrow).
