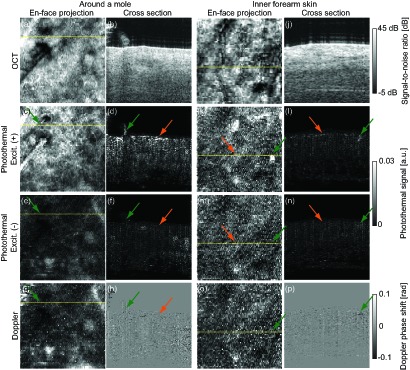
Fig. 7.

Volumes of OCT (first row) and photothermal OCT (second and third rows) images of human skin. Images in the the fourth row are images of Doppler blood flow for comparison. Two volumes around a mole (a–h) and of normal skin (i–p) are obtained. En-face projections (left) indicate the locations of the cross-sectional images (left).
