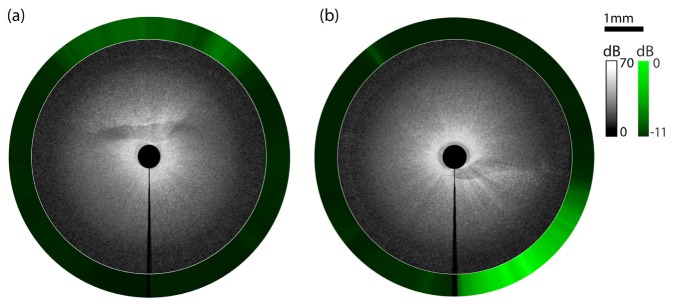
Fig. 10.

Radial images obtained at two pullback locations using the MI needle deep within a whole mouse liver. The fluorescence signal for each radial position is projected onto the circumference. Fluorescently labeled epithelial cells are visible in each image. OCT images show corresponding ductal structures surrounding low backscattering lumen. The vertical black line at the 6 o’clock position marks the start and end location of the needle rotation. Fluorescent signal (in dB) is measured relative to maximum measured fluorescence signal.
