
Fig. 7.
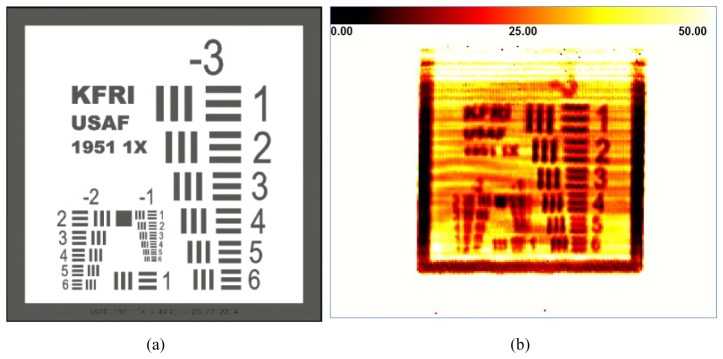
(a) Custom-made resolution chart: chromium patterns on a 2.5 mm thick soda-lime glass. (b) Transmission image (250 × 180 pixels2 with 1.15 mm/pixel resolution) of the custom-made resolution test chart, where intensity values are normalized by the reference signals and the units are percentages. Note that the vertical direction in the transmission images is the fast scan axis, and the horizontal direction is the slow scan axis.