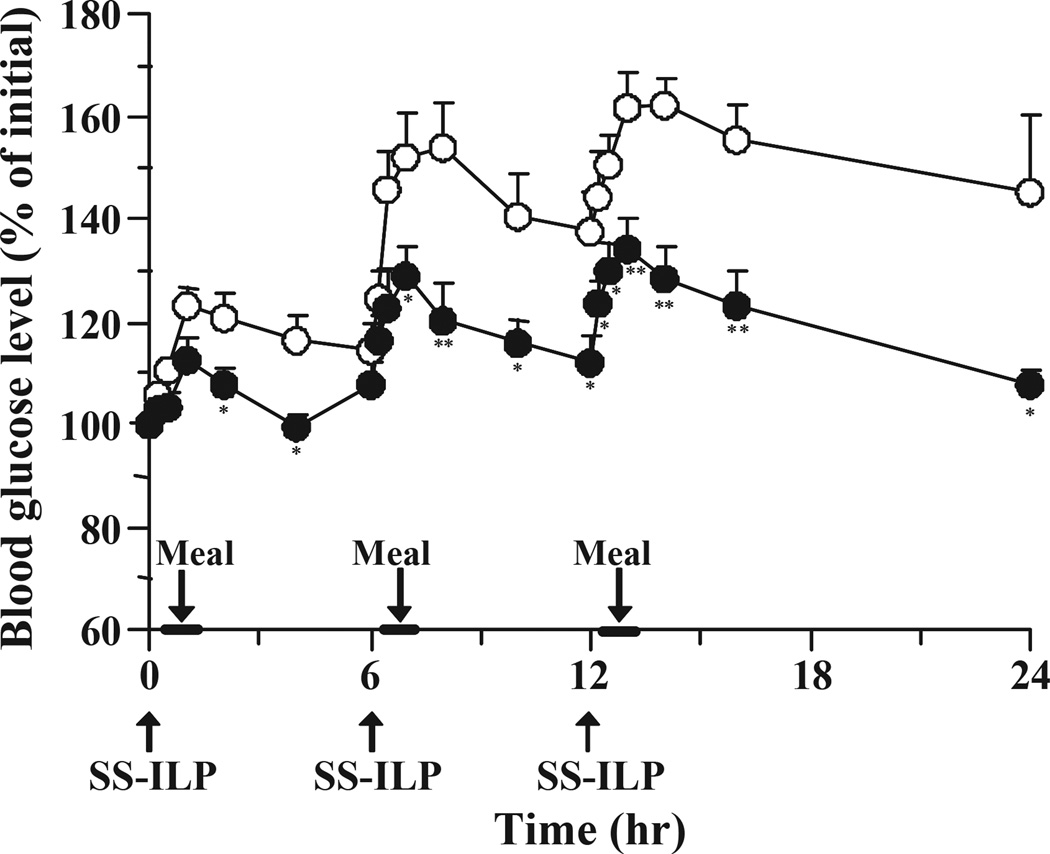
Fig. 5.
Changes in blood glucose level versus time profiles in type 1 diabetic rats following multiple oral administration of SS-ILP (closed circles). Insulin solution was used as control (open circles). Each dose of insulin was 25 IU/kg body weight. Each value represents mean ± S.E. (n = 5 – 10). Statistically significant difference from control: p <0.01, **; p <0.05, *.

