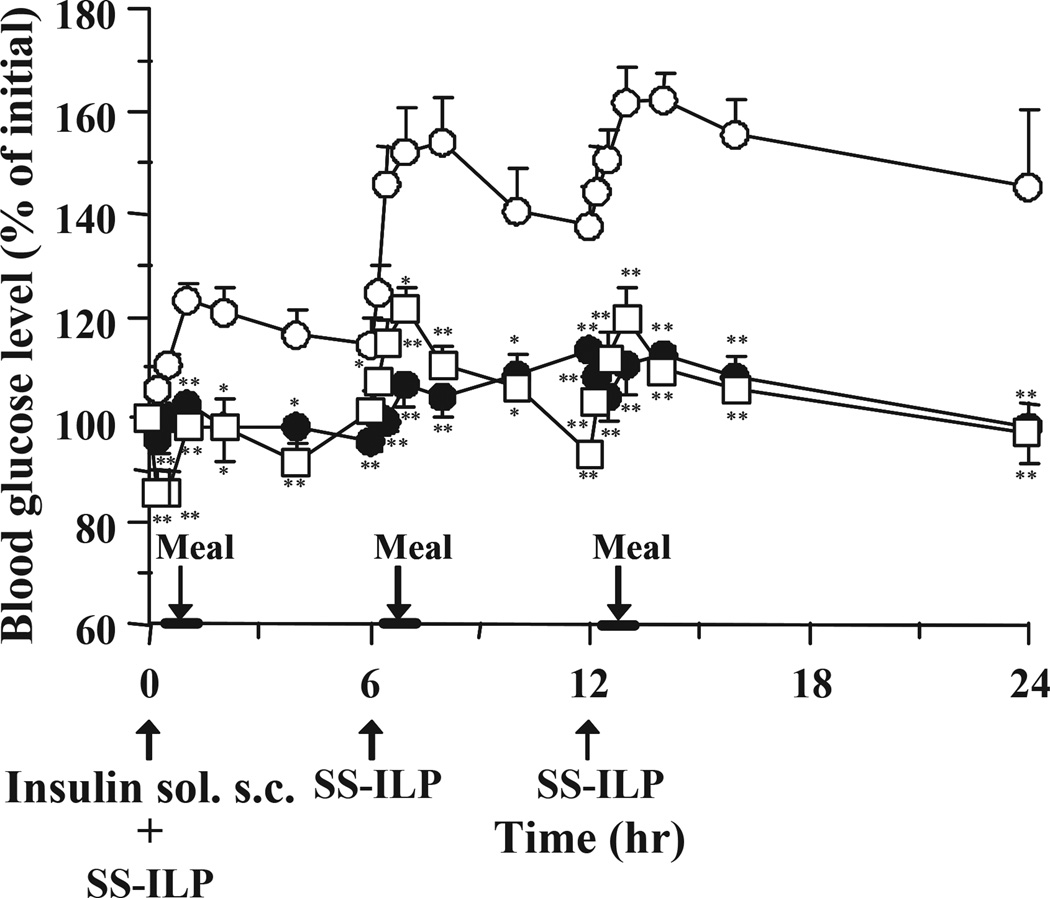
Fig. 7.
Changes in blood glucose level versus time profiles in type 1 diabetic rats following multiple oral administration of SS-ILP and subcutaneous insulin (only at the first dosing) (open square), insulin solution (open circles) and subcutaneous administration of insulin solution (closed circles). Insulin solution was used as control (open circles). The dose of insulin was 25 IU/kg (oral) and 0.1 IU/kg (subcutaneous) body weight. Each value represents mean ± S.E. (n = 5 – 10). Statistically significant difference from control: p <0.01, **; p <0.05, *.

