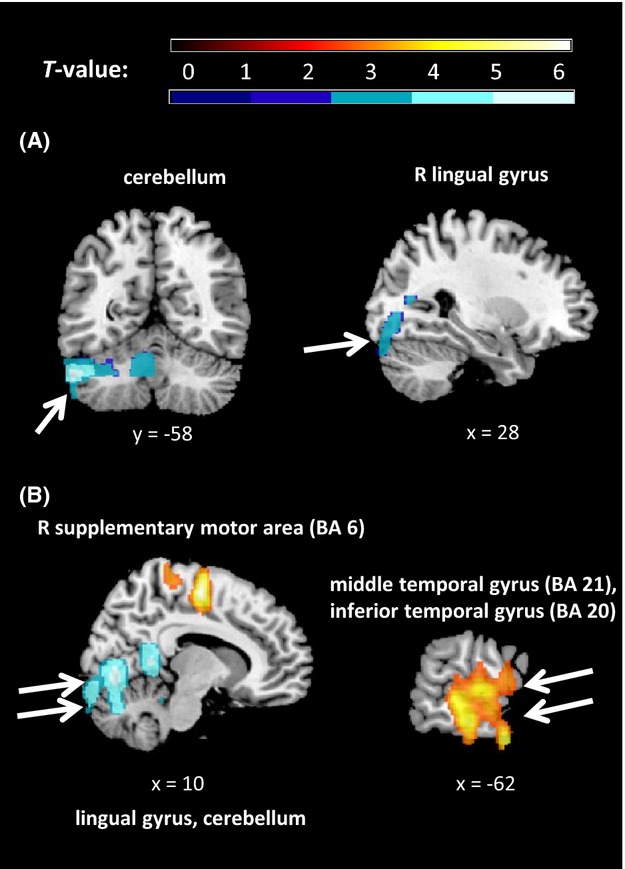
Figure 4.

Results of whole-brain level analyses for the regressions between self-reported depressive symptoms (MFQ) and regional cerebral blood flow (rCBF) difference: (A) sad minus neutral, (B) happy minus neutral, overlaid on a T1-weighted structural brain image. Orange = positive correlation, blue = negative correlation. All locations are reported in MNI coordinates. For illustration purposes, the cluster-level significance is P < 0.05 (AlphaSim corrected). BA, Brodmann area; L, left; R, right.
