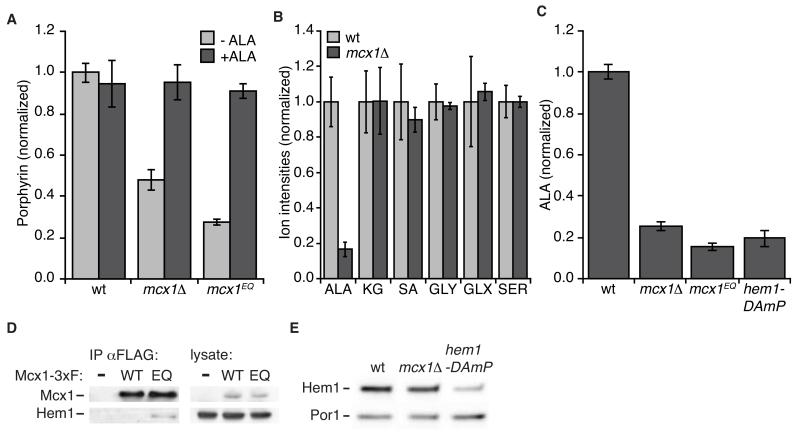
Figure 2.
Mcx1 promotes heme biosynthesis at the step of ALA synthesis. (A) Total porphyrin levels were measured by fluorescence in oxalic acid cell extracts (ex. 400 nm, em. 662 nm; p < 0.001 for difference between wt and MCX1 mutants). +ALA indicates supplementation of growth medium with 50 μg/ml ALA. See also Fig. S2. (B) Metabolites involved in the first step of heme biosynthesis (KG, α–ketoglutarate; SA, succinic acid; GLY, glycine; GLX, glyoxylate; SER, serine) were measured in extracts of the indicated yeast strains by LC-MS. P < 0.001 for ALA perturbation in mcx1Δ cells. (C) ALA levels in cell extracts were measured using modified Ehrlich’s reagent. p ≤ 10−5 for ALA reduction in MCX1 and HEM1 mutants. (D) Mcx1 was isolated with α-FLAG antibody-conjugated beads from cells harboring HEM1-3xMYC and MCX1-3xFLAG (wt or Mcx1EQ (EQ)) or untagged Mcx1 (−)) alleles at the genomic loci, and eluted with 3xFLAG peptide. The eluate was analyzed by Western blot for Mcx1 (α-FLAG) and Hem1 (α-Myc). See Extended Experimental Procedures for detailed procedure. (E) Cellular levels of Hem1-3xMyc were analyzed by Western blot, using alkaline cell extracts (von der Haar, 2007). Hem1-3xMyc intensity: in mcx1Δ = 1.1 ± 0.1 relative to wt, p = 0.35 for difference; in hem1-DAmP = 0.3 ± 0.1, p = 0.01. The mitochondrial protein Por1 was probed as a loading control. Error bars represent mean ± SD.

