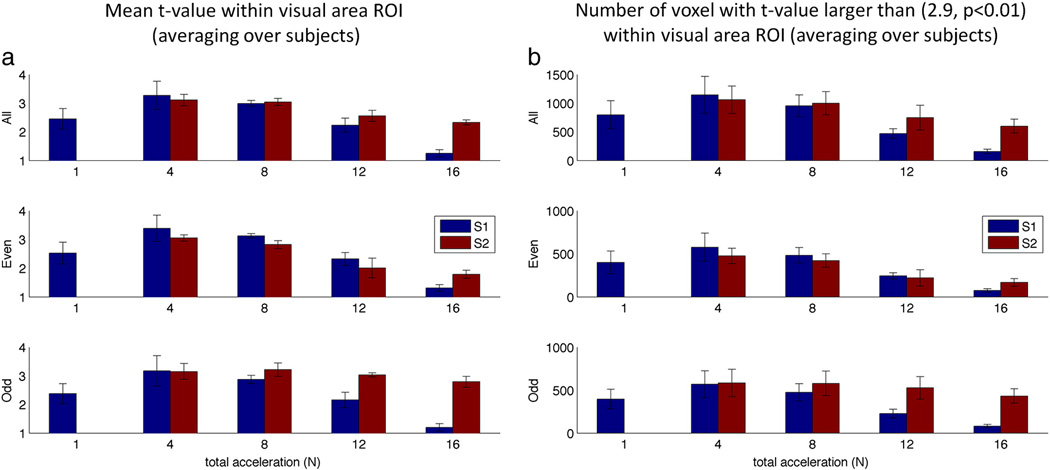
Figure 6.
Mean t-value and number of voxels averaged across subjects in the checkerboard experiment. (a) Mean t-value above the threshold of 2.9 for each acquisition. (b) The number voxels above threshold of 2.9 for each acceleration factor. SIR2 images had two TEs for different slices and the odd slices had longer TE (41 vs 36 ms) that resulted in higher BOLD contrast compared to even slices. Both metrics were calculated within subject specific ROIs.

