
Figure 3.
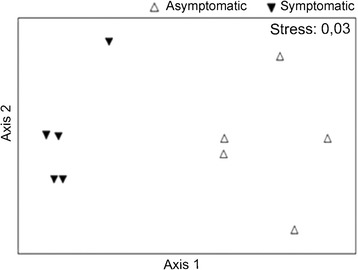
NMDS analysis comparing the endophytic bacterial community structure of asymptomatic and symptomatic anthracnose plants. Each point represents the DGGE profiles for each treatment.
Official websites use .gov
A
.gov website belongs to an official
government organization in the United States.
Secure .gov websites use HTTPS
A lock (
) or https:// means you've safely
connected to the .gov website. Share sensitive
information only on official, secure websites.
NMDS analysis comparing the endophytic bacterial community structure of asymptomatic and symptomatic anthracnose plants. Each point represents the DGGE profiles for each treatment.