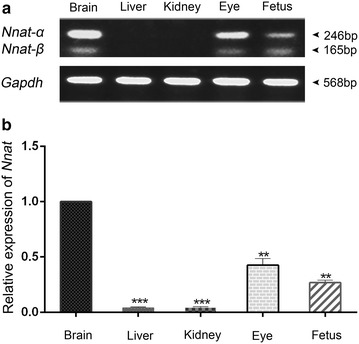
Figure 2.

The expression levels of rabbit Nnat in different rabbit tissues. a RT-PCR detection of the Nnat α-form (246 bp) and β-form (165 bp) in brain, liver, kidney, eye and fetus. Gapdh was used as control for RNA/cDNA integrity. b The comparison of Nnat expression levels in brain, liver, kidney, eye and fetus by qPCR. Gapdh was used as a reference gene. Data are shown as mean ± SEM (n = 6). **(p < 0.01) and ***(p < 0.001) indicate statistically significant differences.
