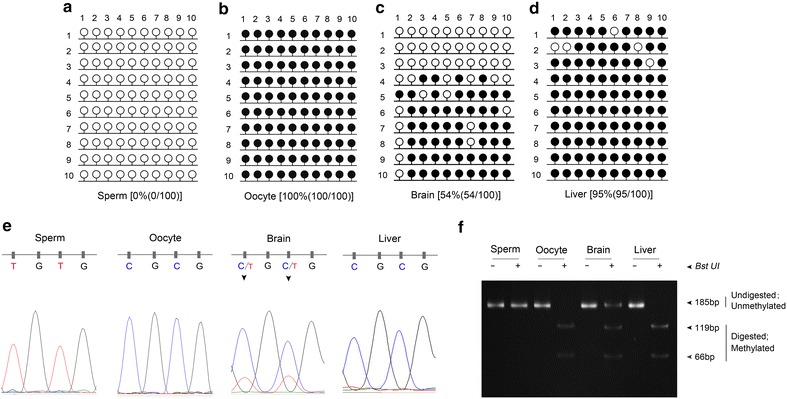
Figure 3.

The methylation status of the Nnat promoter region in rabbits. The methylation status was analyzed in sperm (a), MII oocytes (b), brain (c) and liver (d) by BSP. The open and closed circles indicate unmethylated and methylated CpG sites, respectively. The number in the parentheses represents the methylated CpG sites relative to the total CpG sites counted. e The sequencing analysis of the CpG island within the Nnat promoter in BstUI recognition sites in the sperm, MII oocytes, brain and liver. Inverted black triangles indicate differentially methylated cytosine. f COBRA analysis of the products of BSP, which were digested with (+) or without (−) restriction enzyme BstUI in sperm and MII oocytes, brain and liver. Fully methylated CpG sites are represented by two DNA fragments (66 and 119 bp) and unmethylated CpG sites are represented by one DNA fragment (185 bp).
