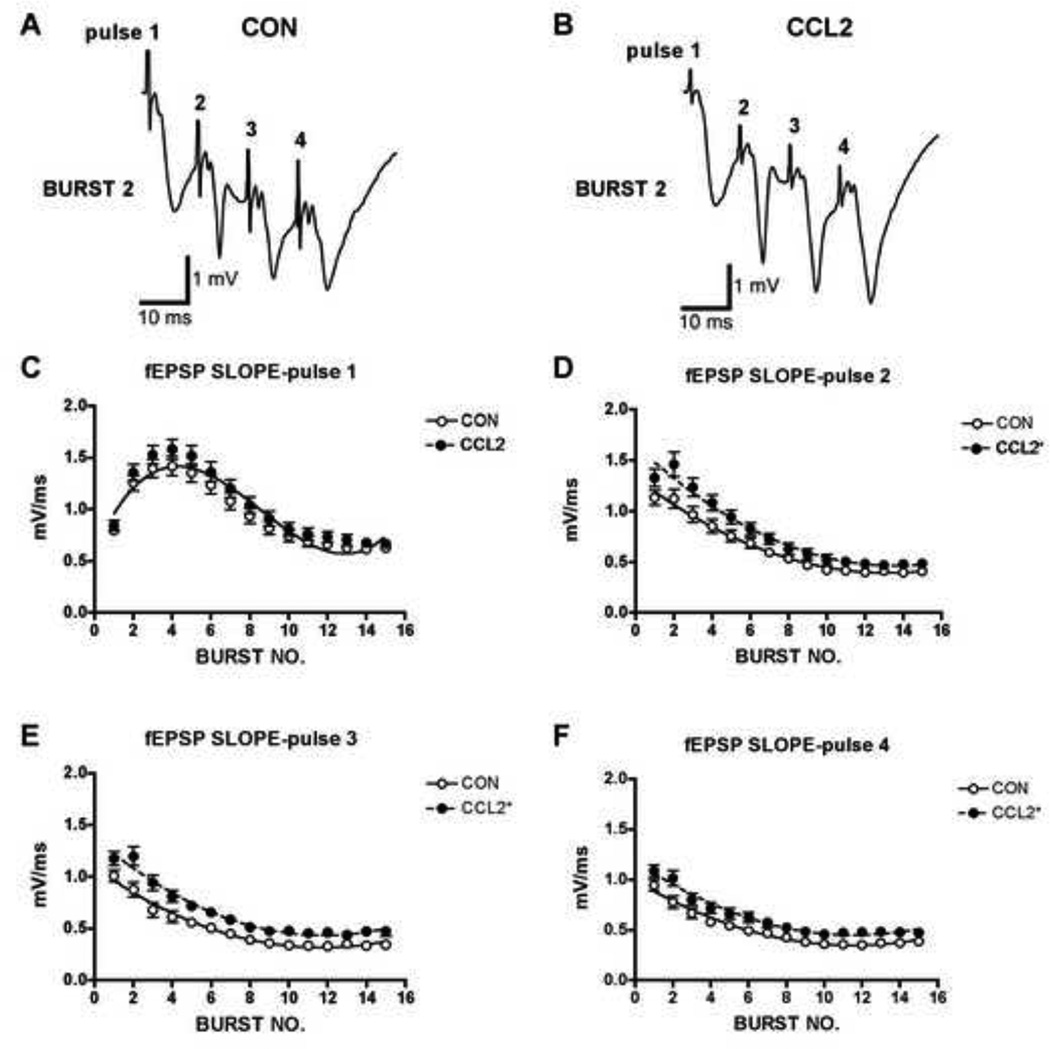
Figure 7.
Field excitatory postsynaptic potentials (fEPSPs) in hippocampal slices from CCL2 transgenic mice were facilitated compared to control hippocampal slices during theta burst stimulation (TBS) protocols. TBS consisted of 15 bursts (200 ms interburst interval, or 5 Hz) of 4 stimulus pulses (10 ms interpulse interval, or 100 Hz). A,B. Representative recordings of fEPSPs in CCL2 and control hippocampal slices during TBS. C–F. Graphs of mean±SEM values for fEPSP slopes in CCL2 (n=35) and control (n=43) hippocampal slices during TBS. fEPSP slope for each pulse of the four-pulse theta burst was measured independently and plotted across the 15 burst repetitions (i.e., burst no.). Pulse 1 data were best fitted with a third-order polynomial. Pulses 2–4 data were best fitted with a second-order polynomial. For each pulse, fitted curves in CCL2 slices were significantly different from control curves as determined by nonlinear regression analysis. This difference is indicated by a significant upward shift in the curves from CCL2 hippocampal slices relative to control hippocampal slices (CCL2 Y-intercept increased in D-E, P<0.0001, and in F, P<0.0005; F test).

