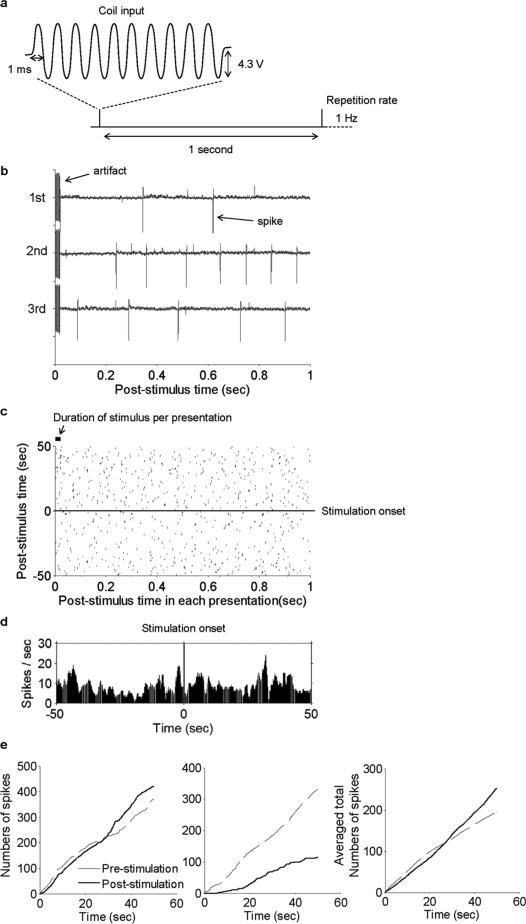
Fig. 3.
Sinusoidal μMS stimulation suppresses activity in most STN neurons. (a) Input to the coil consisted of ten cycles of a 500-Hz sinusoid with a constant amplitude of 4.3 V; this pattern of ten cycles was repeated every 1 s (1 Hz). (b) Typical recording traces that show the stimulus artifact as well as the spikes that arose during the 1-second time period following the stimulus. (c) Peri-stimulus time raster plot for 50 one-second periods pre-stimulus (below horizontal line) and 50 one-second periods post-stimulus (above line). (d) Peri-stimulus time histogram (PSTH) for all pre- and post-stimulus time periods (Binsize = 0.1 s) (e) Total spike counts versus time for pre- and post-stimulation time periods. Left panel is the cell from Panels b-d; center panel is from a different cell; right panel is the average from all cells (n = 28).

