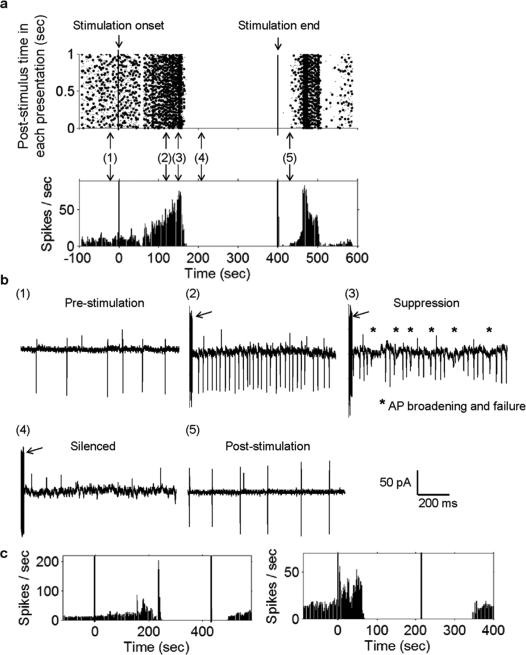
Fig. 4.
Prolonged sinusoidal μMS stimulation suppresses activity in most STN neurons. Response of a typical STN neuron to ten cycles of a 500-Hz sinusoid delivered at a repetition rate of 1 Hz. (a) Peri-stimulus raster plot from a typical cell (top); each column depicts the spikes that occurred in the one-second interval corresponding to that time. The corresponding PSTH is shown at the bottom. Left and right vertical lines indicate onset and offset of μMS (respectively). (b) Panels 1–5 reveal expanded one second snapshots of the cell's response; panels correspond to the time points indicated in (a). The arrows in Panels 2–4 point to the electrical artifact associated with the μMS stimulus. (c) Typical PSTHs from two other STN neurons that were also silenced. Note that the duration over which μMS was applied was not uniform for all cells.

