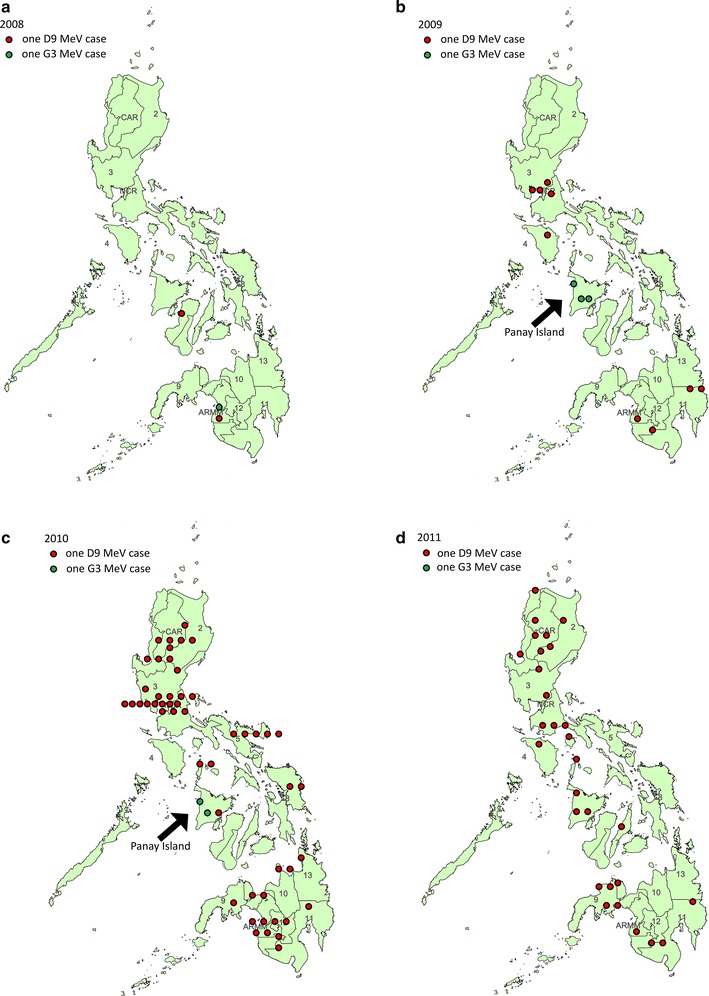
Figure 3.

Geographic distribution of genotypes D9 and G3 in the Philippines. Distribution of genotypes D9 (red circle) and G3 (green circle) in 2008 (a), 2009 (b), 2010 (c), and 2011 (d). One circle represents one case of MeV infection. Numbers represent the different administrative regions in the country. CAR Cordillera Autonomous Region, NCR National Capital Region, ARMM Autonomous Region in Muslim Mindanao.
