
Figure 3.
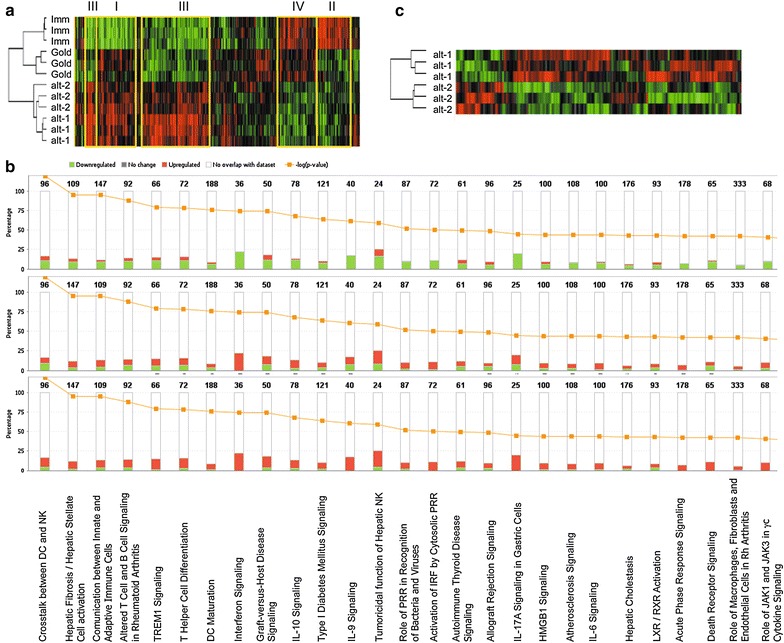
Effect of different maturation cocktails on DC transcriptome. Immature DC were compared to cells stimulated with gold standard, alt-1 and alt-2 maturation cocktails using cDNA array. Three different donors were used for the evaluation. The heat map of genes differentially regulated among the four DC types (a) or just the two alternative DC (c) are shown. b Distribution of the differentially expressed genes in the canonical pathways is shown for each mature DC (gold standard DC, top; alt-1 DC, middle; alt-2 DC, bottom) versus the immature DC. The numbers above the bars indicate the number of genes belonging to the different pathways, whereas the yellow line indicates the -Log10 of the p value of the modulation for each family.