
Figure 5.
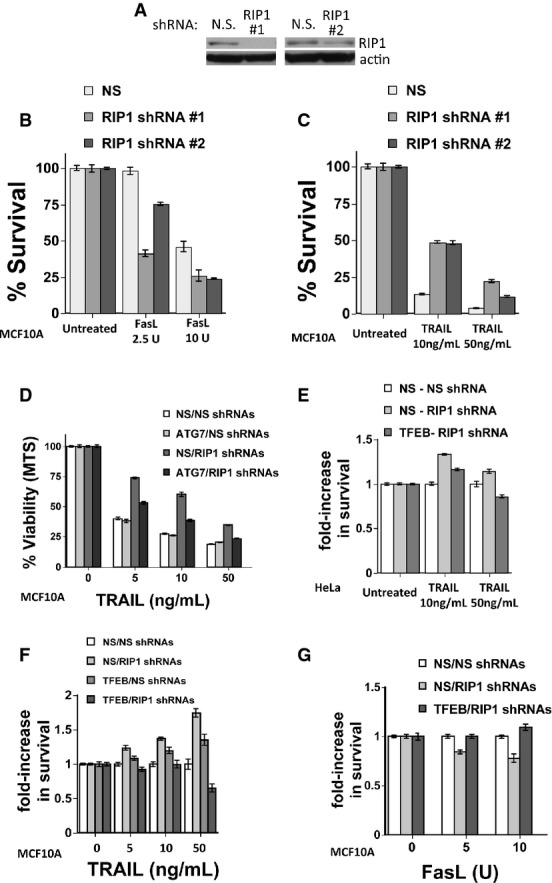
RIP1 depletion affects death receptor-induced cell death in part through effects on TFEB and autophagy
- A Western blot of lysates from MCF10A cells expressing non-silencing control or RIP1 shRNAs.
- B, C Cells were then treated with (B) FasL or (C) TRAIL for 24 h, and cell viability was analyzed by MTS. Data shown are mean ± SEM, n = 4.
- D Cell viability (MTS) of TRAIL-treated (24 h) MCF10A cells with double knockdown using non-silencing, ATG7 and/or RIP1 shRNAs. Data shown are mean ± SEM, n = 4.
- E–G Cell viability (MTS) of TRAIL- or Fas-treated (24 h) HeLa (E) or MCF10A cells (F, G) with double knockdown using non-silencing, TFEB and/or RIP1 shRNAs, as indicated. For these experiments, each data point is normalized to the non-silencing control for each treatment dose and condition. Data shown are mean ± SEM, n = 4.