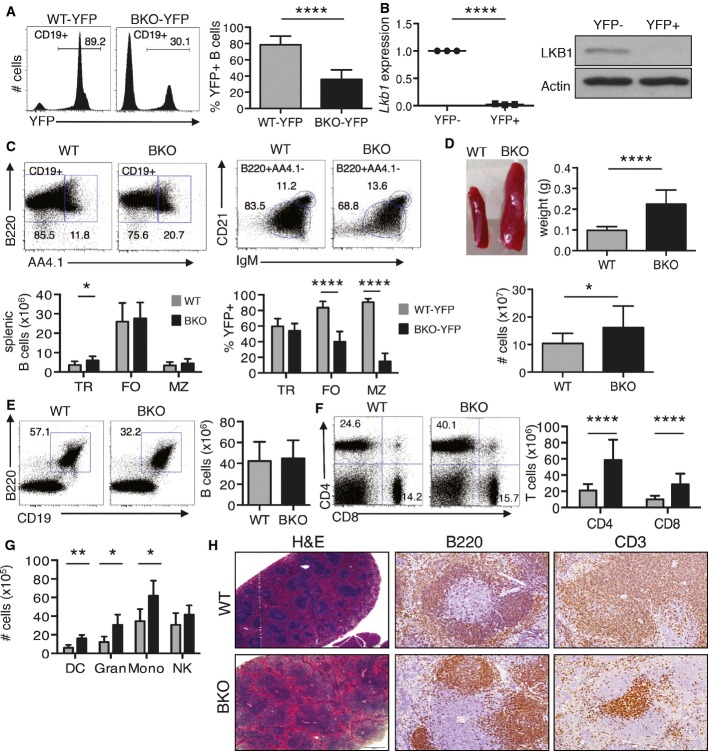
Flow cytometry for YFP expression in CD19+ splenocytes from WT-YFP (n = 7) and BKO-YFP (n = 8) mice. ****P = 4.9E-06 by two-tailed, unpaired Student's t-test.
qRT–PCR (n = 3) and a representative Western blot for LKB1 in YFP-sorted splenocytes from BKO-YFP mice. LKB1 expression, relative to 36b4 expression, shown normalized to LKB1+YPF− CD19+ BKO B cells. ****P = 3.8E-05 by two-tailed, unpaired Student's t-test.
Flow cytometry analysis for splenic transitional (TR: CD19+B220+AA41+), follicular (FO: CD19+B220+AA41−IgM+CD21+), and marginal zone (MZ: CD19+B220+AA41−IgM++CD21++) B cells in WT (n = 8) and BKO (n = 11) mice and the percentage of YFP+ cells for each subpopulation in WT-YFP (n = 7) and BKO-YFP (n = 8) mice. *P = 0.03 by Mann–Whitney U-test and ****P = 3.5E-006 and 1.5E-010 by two-tailed, unpaired Student's t-test, respectively.
Representative images of spleens from WT and BKO mice. Weight of WT (n = 34) and BKO (n = 34) spleens and cell numbers recovered from WT (n = 13) and BKO (n = 18) spleens. *P = 0.011 and ****P = 9.7E-13 by two-tailed, unpaired Student's t-test.
Flow cytometry and number of B220+CD19+ splenic B cells from WT (n = 13) and BKO (n = 18) mice.
Flow cytometry and number of CD4+ and CD8+ T cells from WT (n = 11) and BKO (n = 11) mice. ****P = 1.1E-06 and 4.6E-06, respectively, by Mann–Whitney U-test.
Non-lymphocyte white blood cells in spleens calculated by flow cytometry from WT (n = 5) and BKO (n = 5) mice. **P = 0.008, *P = 0.03 and 0.032, respectively, by two-tailed, unpaired Student's t-test.
Histologic sections of WT and BKO spleens stained with hematoxylin and eosin (H&E), anti-B220, or anti-CD3 antibodies. Scale bar represents 500 microns.
Data information: (A, C–G) Mean ± s.d. (B) Mean ± SEM.

