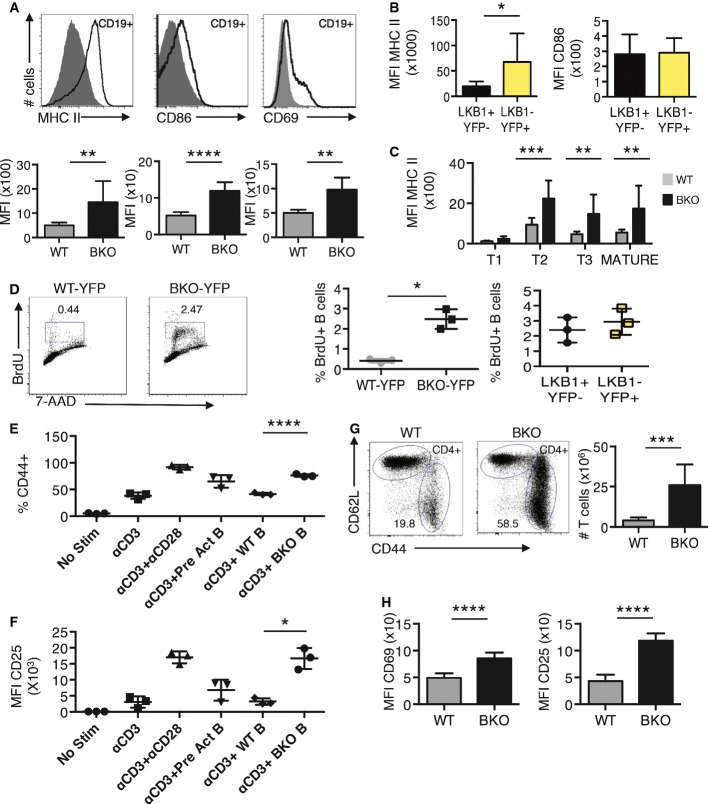
A Flow cytometry for MHC II (n = 8 and 11), CD86 (n = 6 and 9), and CD69 (n = 5 and 7) activation biomarkers and mean fluorescence intensity (MFI) for CD19+ splenocytes from WT and BKO mice. **P = 0.005, ****P = 9.1E-06, and **P = 0.002 by two-tailed, unpaired Student's t-test.
B MFI of MHC II (n = 9 each) and CD86 (n = 6 each) of LKB1+YFP− and LKB1−YFP+ CD19+ B cells from BKO mice. *P = 0.02 by two-tailed, unpaired Student's t-test.
C MFI of MHC II for transitional and mature B-cell subsets from WT (n = 8) and BKO (n = 11) spleens. ***P = 0.0007, **P = 0.006 by two-tailed, unpaired Student's t-test.
D Flow cytometry plot of BrdU incorporation into harvested splenic B cells during a 30-min pulse and BrdU incorporation in LKB1+YFP− and LKB1−YFP+ B cells from BKO-YFP mice. Three independent experiments; *P = 0.015 by two-tailed, unpaired Student's t-test.
E, F CD4- and CD62L-enriched, naïve T cells were co-incubated with anti-CD3 Ab and either anti-CD28 Ab, WT B cells pre-activated for 24 h, fresh CD43-depleted WT B cells, or fresh CD43-depleted BKO B cells for 48 h. Cultures were then harvested for analysis by flow cytometry. (E) Percentage of CD4+CD62L+CD44+-activated T cells in listed culture conditions (n = 3). Three independent experiments; ****P = 5.9E-05 by two-tailed, unpaired Student's t-test. (F) MFI of CD25 activation biomarker on CD4+ T cells in listed culture conditions (n = 3). Three independent experiments; *P = 0.0135 by two-tailed, unpaired Student's t-test.
G Flow cytometry for the expression of CD4, CD62L, and CD44 in splenocytes from WT (n = 5) and BKO (n = 7) mice. ***P = 0.0025 by Mann–Whitney U-test.
H MFI for CD69 and CD25 activation biomarkers in CD4+ splenic T cells from WT (n = 5) and BKO (n = 7) mice. ****P = 0.0001 and 3.4E-06, respectively, by two-tailed, unpaired Student's t-test.
Data information: Mean ± s.d.

