
Figure 6.
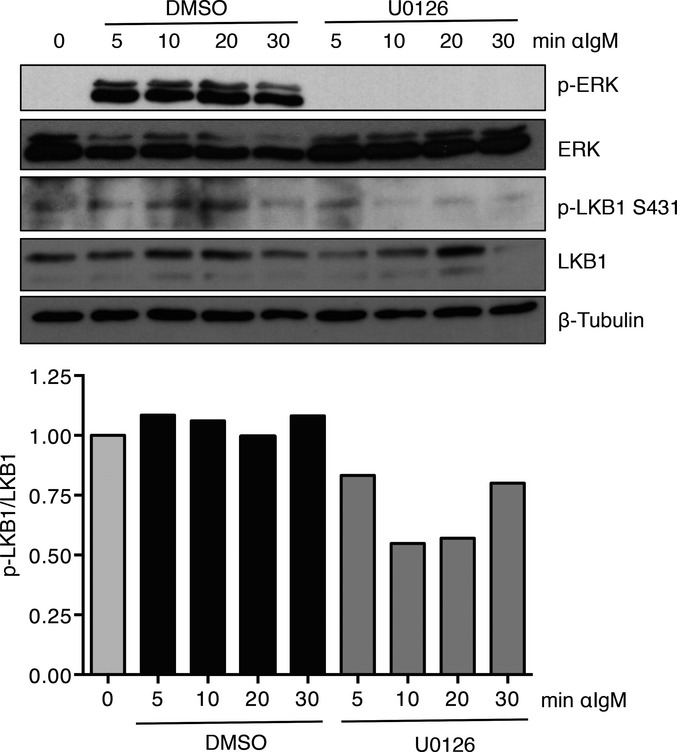
BCR signaling results in inhibitory LKB1 S431 phosphorylation
Representative Western blot of phosphorylation of LKB1 on serine 431 in CD43-depleted WT B cells stimulated with F(ab2) fragments of anti-IgM and either DMSO or U0126 for the indicated times. Ratio of phospho-LKB1 to total LKB1 expression, normalized to T = 0, is shown as mean for three independent experiments.