
Figure 3.
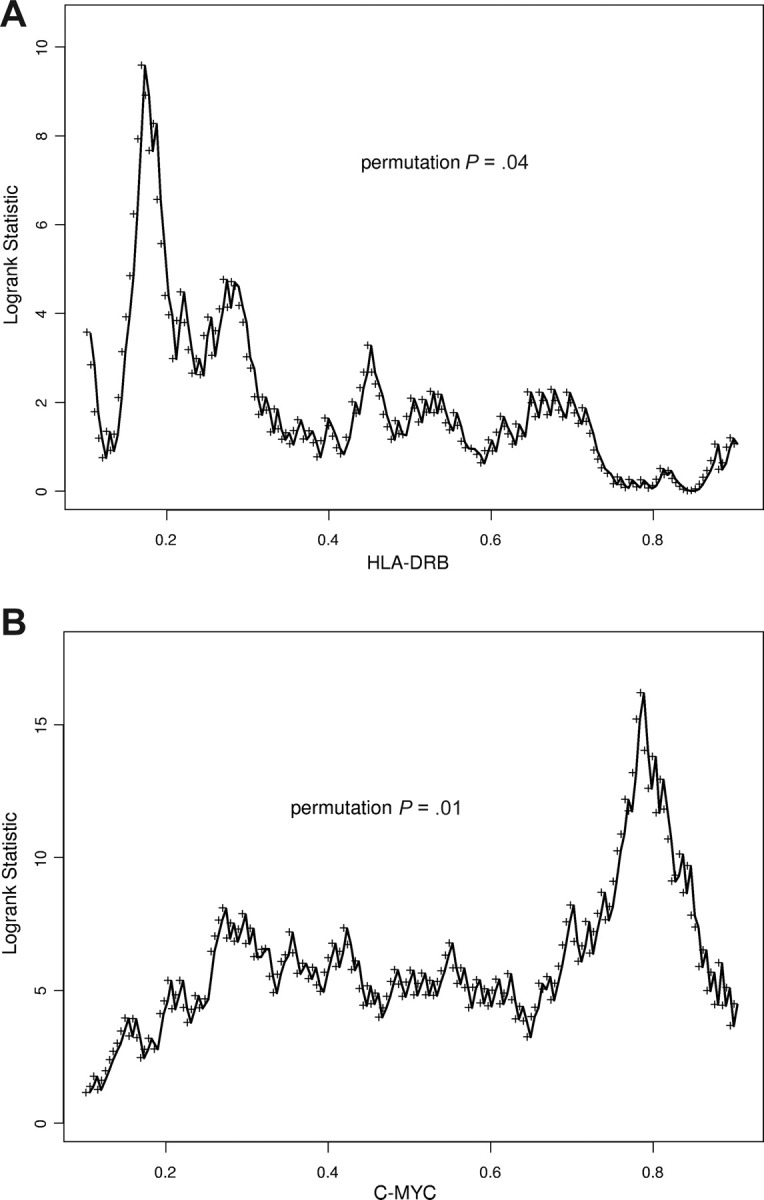
Variable cutoff point analysis for HLA-DRB and MYC genes. Gene expression level on x-axis; log rank score on y-axis; permutation P value indicated. (A) HLA-DRB. (B) MYC. The peaks in the log rank scores indicate the most significant cut-off points in the data yielding the largest differences in overall survival.