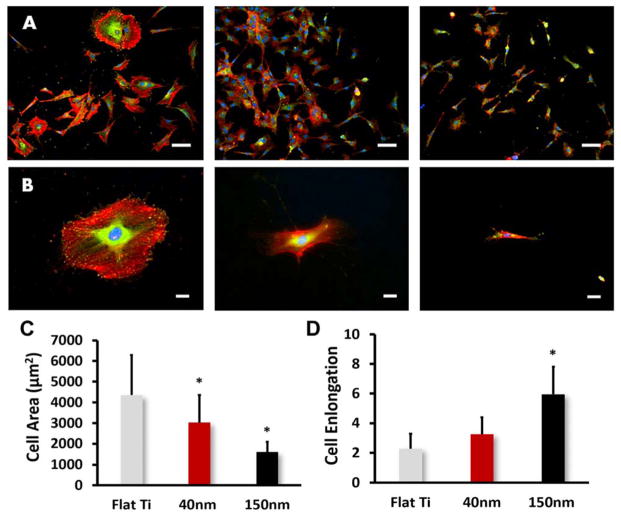
Fig. 2.
Immunofluorescent images of vinculin (FITC-green), cytoskeletal actin (TRITC-red) and nucleus-staining (DAPI-blue) for MC3T3 cells on Flat Ti, 40nm TNTs and 120nm TNTs. (A) Magnification of 10× (Scale bars = 200 μm), (B) Magnification of 20× (Scale bars = 50 μm), (C) Cell area and elongation vs. nanotube size. The bar graphs show the average ± standard error bars. Statistical significance (p < 0.05) are marked on the graphs with *.

