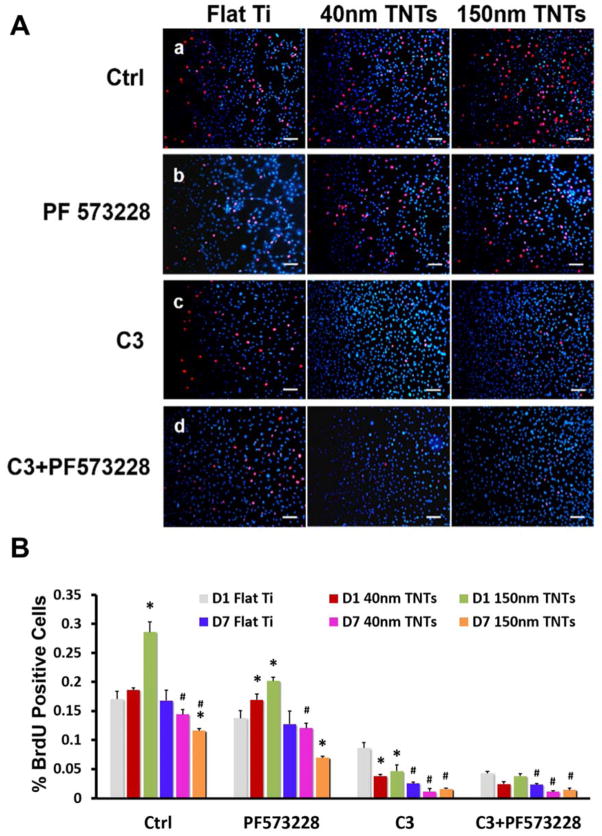
Fig. 4.
(A) Immunofluorescent images of BrdU-labeled nuclei (imerged image of TRITC-red and DAPI-blue) for MC3T3-E1 cells after one day culture. Scale bars = 200 μm. a. control group (regular medium), b. Regular medium + PF573228, c. Regular medium + C3 and d. Regular medium+ C3 + PF573228. (B) Quantification of BrdU-labeled nuclei for Day 1 and Day 7 culture. The statistical significance (p < 0.05) after performing t-tests are marked: *, indicates a significant difference between the cells growing on different substrates with same treatment and at the same time point, compared with Flat Ti; #, denotes a significant difference between different time points on the same substrate and with same treatment, compare with D1.

