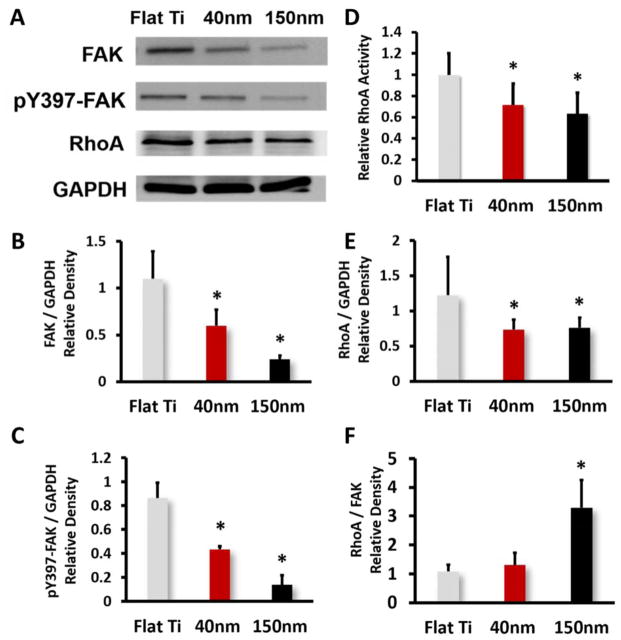
Fig. 5.
(A) Protein expression level of FAK, pY397-FAK and RhoA in MC3T3-E1 cells after one day culture on different substrates, (B) Densitometric quantification of total FAK, (C) Densitometric quantification of pY397-FAK, (D) RhoA activity level detected with G-LISA™ assay, (E) Densitometric quantification of RhoA and (F) Densitometric quantification of RhoA/FAK. Values are expressed as means ± SD. * Significant difference in protein expression of cells on different substrats (p < 0.05).

