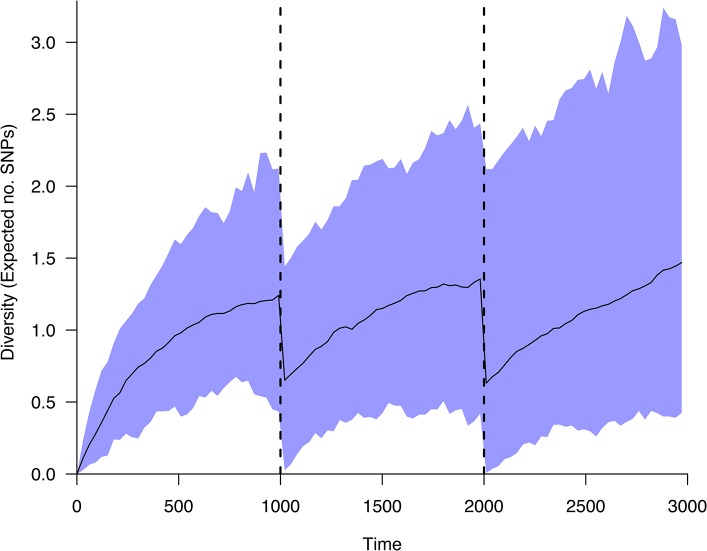
Fig 3. Genomic diversity in a population undergoing bottlenecks.
Expected diversity within a population undergoing bottlenecks of size 2 at times 1000 and 2000. A total of 100 populations were simulated over 3000 generations, starting with a single genotype. The black line indicates the mean diversity of the simulations, with the shaded blue area representing the central 95% quantile. Figure plotted using the diversity.range() function.

