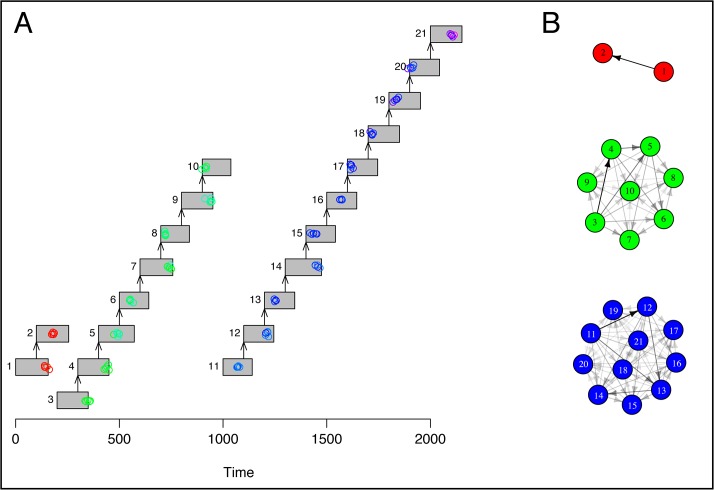
Fig 6. Evolutionary dynamics and estimated routes of infection on a disconnected transmission tree.
We simulated evolutionary dynamics on top of a pre-specified transmission tree, in which three cases are imported to the community under observation. (A) Genomes are represented by colored circles, colored according to genetic distance from the first sampled genome in individual 1; red denotes an identical genotype, while colors closer to the blue end of the spectrum denote an increasing genetic distance from this reference genome. The expected genetic distance between imported cases was 12 SNPs. (B) Estimated routes of infection. We assumed that recovery times were not observed, such that any previously infected host could be the source of infection at the time of transmission. Routes with posterior probability < 0.05 are not shown. This network diagram was plotted using the igraph package [32].

