
Figure 3.
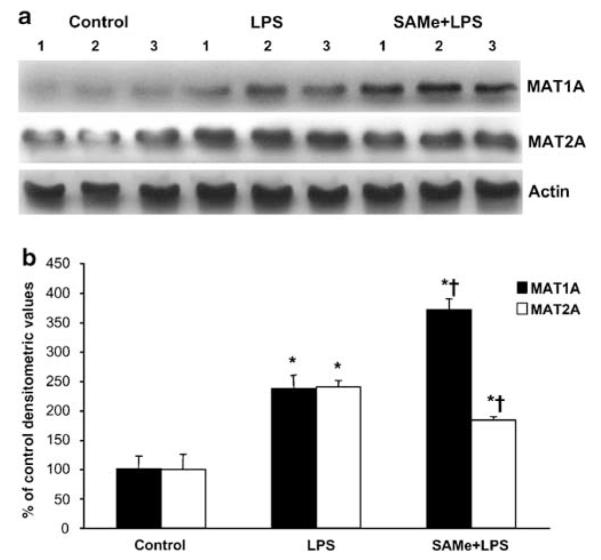
Hepatic MAT1A and MAT2A protein levels during endotoxemia. (a) Steady-state protein levels of MAT1A and MAT2A were determined by western blot analysis as described in ‘Materials and Methods’. Actin was used for housekeeping control. (b) Densitometric values of the western blots are shown normalized to actin. *P < 0.05 vs control group, †P < 0.05 vs LPS.