Figure 5.
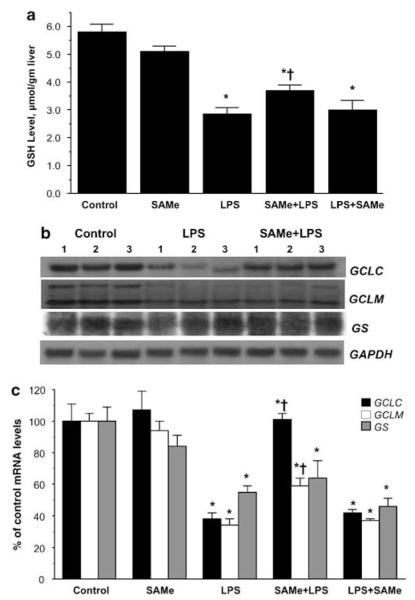
Hepatic GSH and mRNA levels of GSH synthetic enzymes during endotoxemia. (a) GSH levels during endotoxemia. GSH levels were measured as described in ‘Materials and Methods’. *P < 0.0005 vs control group, †P < 0.05 vs LPS group, n = 4–9 per group. (b) Steady-state mRNA levels of GCLC, GCLM, and GS were determined by northern blot analysis as described in ‘Materials and Methods’. GAPDH was used as the housekeeping gene. (c) Summary of results expressed as % of control mRNA levels as determined by both northern blot analysis and real-time PCR. SAMe pretreatment group is labeled SAMe + LPS and SAMe post-treatment group is labeled LPS + SAMe. *P < 0.005 vs control group, †P < 0.05 vs LPS group, n = 4–8 per group.

