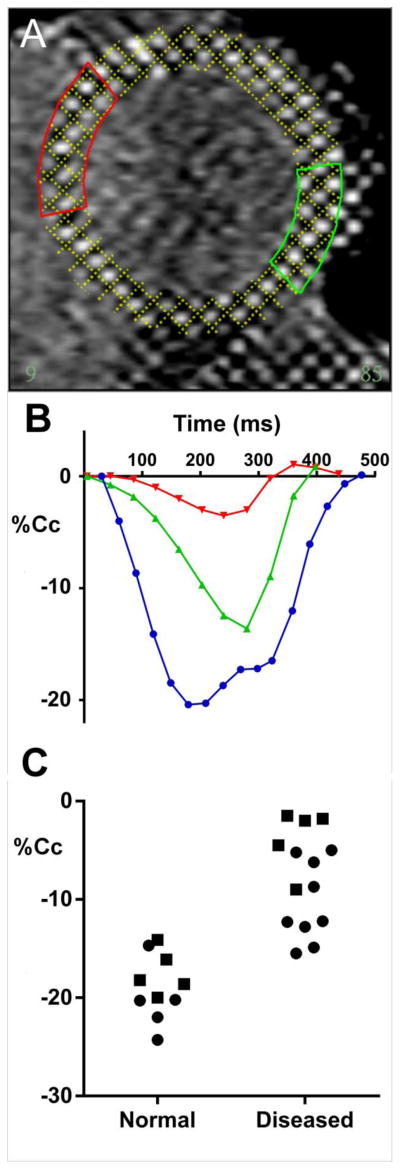
Figure 2.
Regional sampling from cMRI. Panel A shows a typical heart short axis view of a patient with idiopathic dilated cardiomyopathy, the tagging marks are fitted by a model computer grid whose dimensions during the contraction/relaxation cycle give regional circumferential contration (%Cc). B shows regional shortening from two regions identified by color in A. Note the marked difference in contractile performance between these regions. For reference, shortening from a normal human heart cMRI is shown in blue. Panel C shows %Cc a sample of for healthy volunteers and heart failure patients. The symbols denote septum (circles) versus LV free wall (squares).

