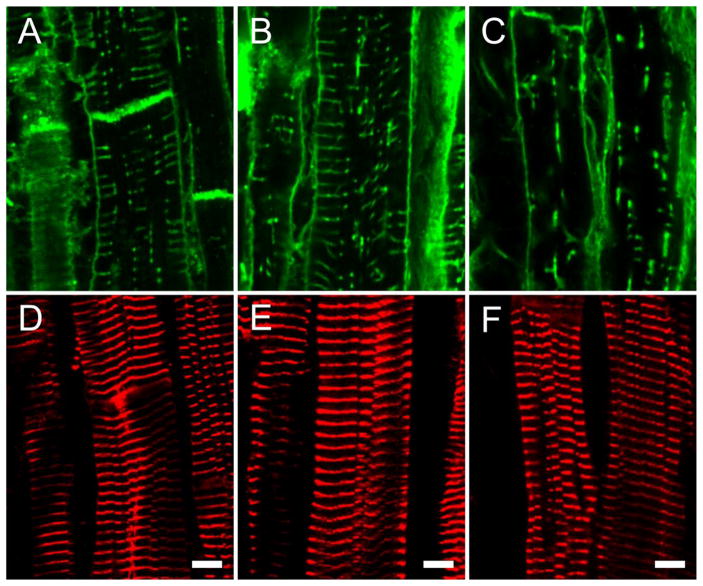
Figure 3.
t-tubule and sarcomere labeling. Panels A,B and C show exemplar confocal micrographs of WGA stained t-tubules from normal, strongly contracting (Cc > 12%) and weakly contracting (Cc <1.8%) diseased hearts respectively. Panels D,E and F show z-lines (alpha actinin labelled) of same regions as shown in panels A, B and C respectively.

