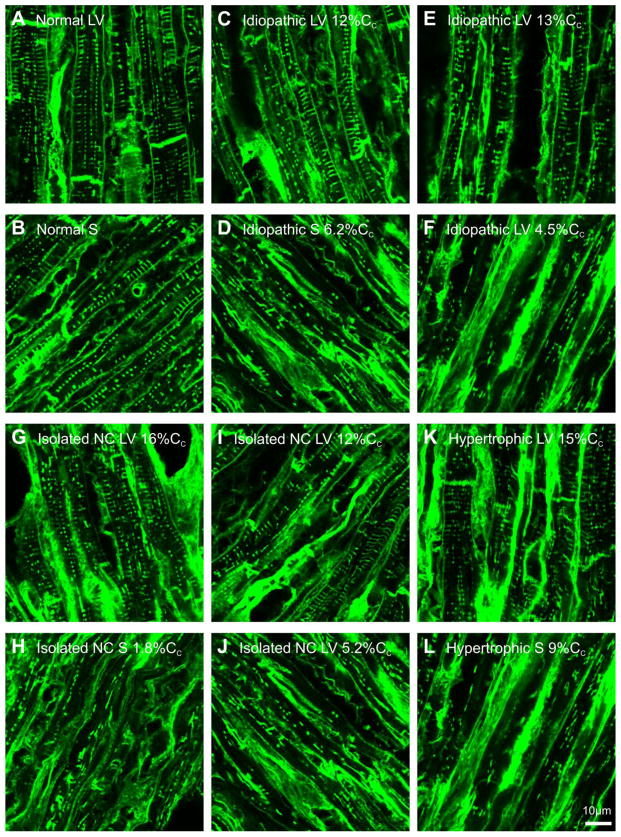
Figure 4.
Lower magnification views of WGA labelling of t-tubules in failing human heart regions with variable levels of fractional shortening (%Cc). Panel A shows normal left ventricle (LV) and panel B shows normal septum (S) labelling. Panel C shows labelling of idiopathic LV (patient 1) with strong fractional shortening (12%Cc) and panel D shows S labelling associated with weak fractional shortening (6.2%Cc) from the same patient shown in panel C. Panel E shows labelling of an idiopathic LV (patient 2) with strong fractional shortening (13%Cc) and panel F shows labelling in a region with weak fractional shortening (4.5%Cc) (same patient shown in panel E). Panel G shows isolated non-compaction LV (patient 3) with strong fractional shortening (16%Cc) and panel H shows S labelling with weak fractional shortening (1.8%Cc) (same patient as shown in panel G). Panel I shows isolated non-compaction LV (patient 4) with strong fractional shortening (12%Cc) while panel J shows LV labelling associated with weak fractional shortening (5.2%Cc) from same patient shown in panel I. Panel K shows hypertrophic LV (patient 5) with strong fraction shortening (15%Cc) while panel L shows S labelling associated with moderate fractional shortening (9%Cc) from the same patient as shown in panel K.

