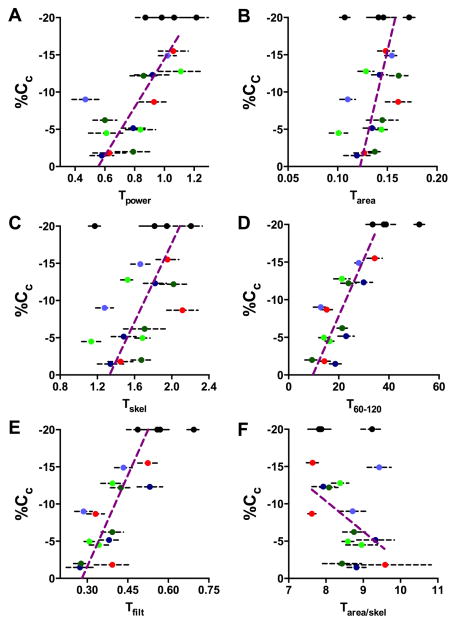
Figure 5.
Human t-tubule morphological analysis. Panel A shows the relationship between Tpower and %Cc for all samples analyzed. In all panels, each patient is indicated by a different color (see below) and error bars are 1SE. B Tarea measured by pixel thresholding. C Tskel measured from the skeleton of the thresholded area image. D shows the percentage of TTs that are within 30 degrees of being transverse to the long axis of the cell (T60-120). E the fraction of energy retained by transverse and longitudinal Sobel filters – note the close similarity of this metric to T60-120 (panel D). F shows a proxy for mean TT diameter derived by the division of Tarea by Tskel. In all panels a Deming regression line is shown to summarise the relationship between the TT metric and %Cc for the diseased samples only with samples from normal hearts being shown by black circles at an assumed 20%Cc. Analysis of samples from patient 1 (table 1) is shown in dark green; patient 2 in light green; patient 3 in red; patient 4 in dark blue; patient 5 in light blue.

