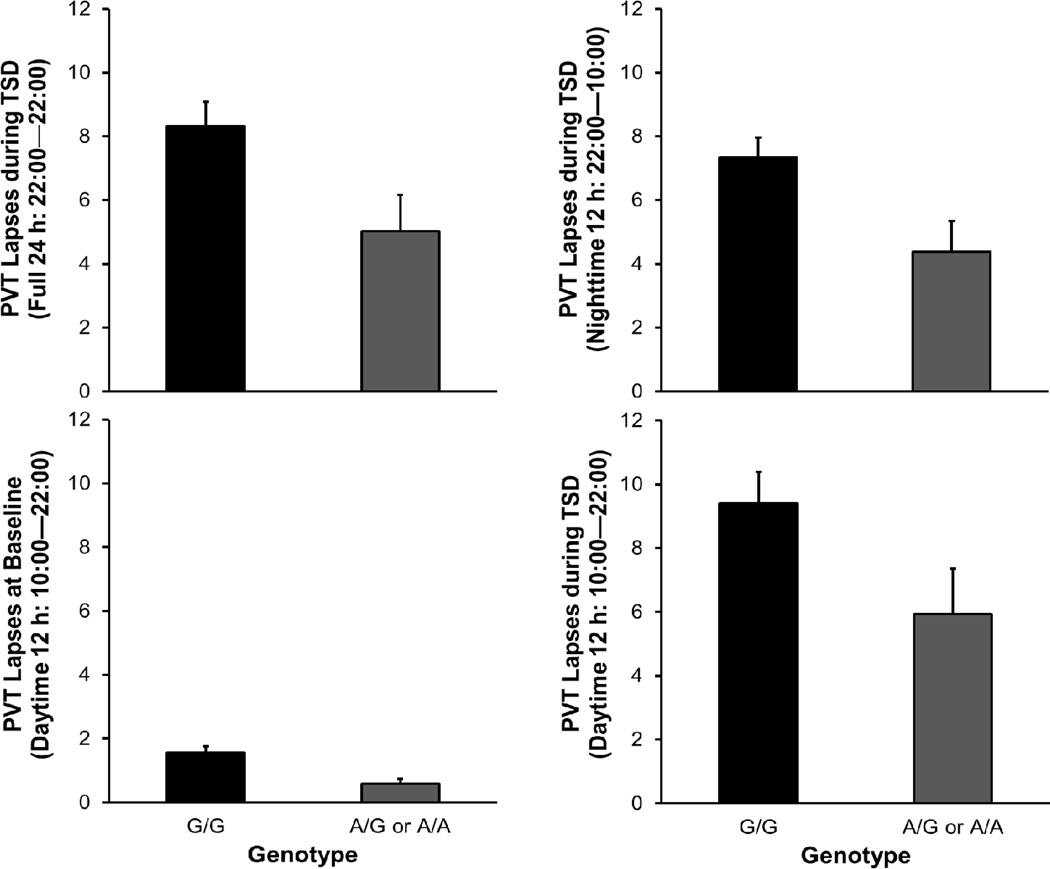
Fig. 2.
Average number of PVT lapses as a function of genotype. The panels on the left show performance across 24 h of TSD (top) and at baseline (bottom). The panels on the right show performance during the first 12-h period of TSD (22:00–10:00; top) and the second 12-h period of TSD (10:00–22:00; bottom), where times of day during the second 12-h period correspond to those of the baseline period. Error bars denote standard error.

